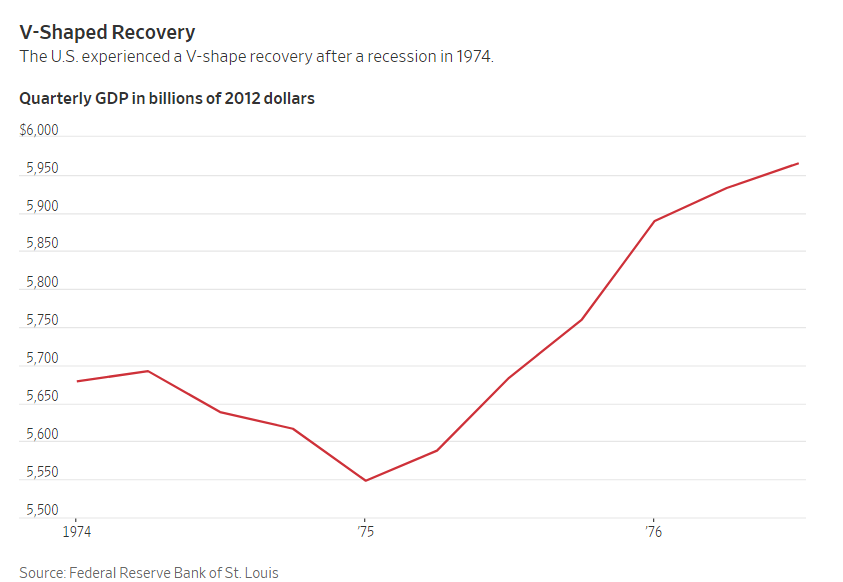
Many economists were hoping for a V-shaped recovery; a short sharp collapse followed by a bounce back to pre-coronavirus levels of activity. The chart below is an example of a V-shaped recovery. It’s from the 1973 recession. A V-shaped recovery means the U.S. gets back to normal growth in fairly quick order. The economic pain is short and sharp but recovery moves at a quick pace.
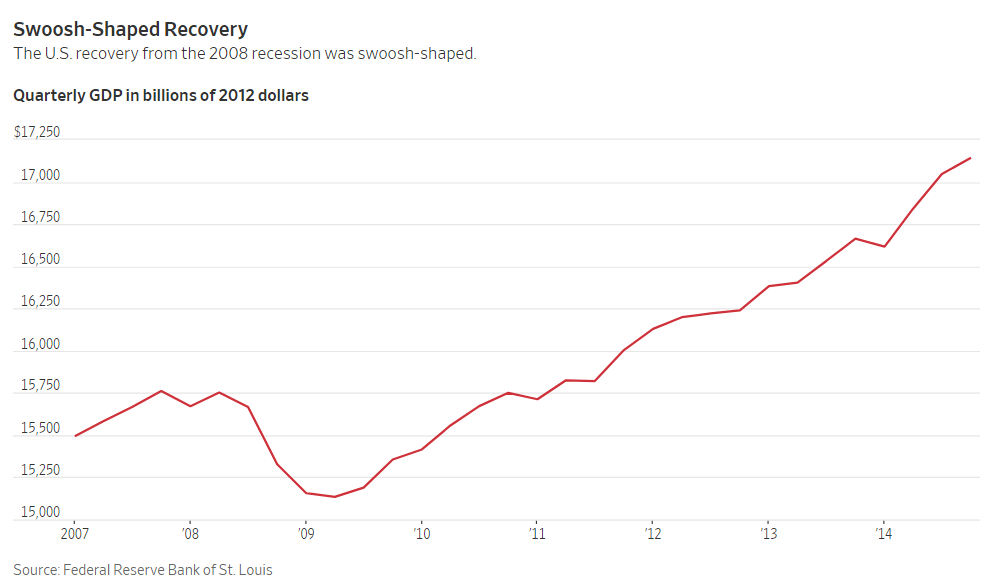
The chart below is an example of a Swoosh recovery. This one is from the 2007 financial crisis and recession. It is markedly different in that, the drop in economic activity is followed by a painfully slow recovery; usually one that takes years.
Economists believe the travel and hospitality industry will be slow to recover. Businesses will restrict travel to what is absolutely necessary and consumers will put off travelling to other locations out of fear of contracting the virus. Consumer-goods companies anticipate that shoppers will switch to cheaper items and eliminate splurges. According to a survey by market-research group Coresight Research, more than 70% of people in the U.S. expect to avoid some public spaces after the lockdowns ease. with more than half saying they expect to stay away from shopping malls. That’s more bad news for chains like Macy’s. The outlook is so uncertain that a string of large companies have suspended financial guidance for the year.
The news isn’t all bad. While the most recent economic expansion (2009 – 2020) may have been as exciting as watching paint dry, it helped add more stability and less volatility to investors portfolios. Let’s hope that when things do begin to get back to some sort of normal, the following 11 years will look like the last 11.
The Markets and Economy
- Factory closures may hurt a struggling U.S. economic rebound. From the makers of fine china in North Carolina to furniture foam providers in Oregon, factory shutdown will further erode the domestic industrial base that has been shrinking for decades. Even large employers like General Electric and Raytheon Technologies have said they may not bring all employees back putting a further crimp on a domestic manufacturing rebound.
- J.C. Penney was the latest major retailer to file for bankruptcy last week. The storied company started with its first store in Kemmerer Wyoming in 1902. Originally known as the “Golden Rule” store, James Cash Penney later changed the name to J.C. Penney.
- Retail sales fell 16.4% in April as consumers reigned in spending. Manufacturing output fell 13.7% according to the Federal Reserve.
- China’s auto sales posted a gain in April for the first time in 21 months. Sales grew 4.4% from a year earlier according to the China Association of Automobile Manufacturers.
- Consumer prices in April fell the most since 2008. The 0.8% decline in prices at the consumer level reflects the drop in the cost of energy. airline travel, automobile insurance as well as other goods and services. Demand has been waning since the various shelter-in-place orders were announced in March.
- The U.S. budget deficit soared to a record $1.935 trillion for the 12 month period ending April 30. The various government programs to help consumers and business owners as well as the shifting of the tax filing deadline to July 15 are causing the deficit to be higher. However, as a share of the economy, the deficit has been growing even before the pandemic.
- The federal government isn’t the only one facing soaring budget shortfalls due to the pandemic. States are expected to lose $180 billion in revenue through mid-2021. Local governments could lose $90 billion.
- Less than 3.8% of U.S. mortgages were delinquent at the end of 2019; the lowest rate since the 1970’s. That rate has more than doubled to 8% according to the Mortgage Bankers Association.