As jobless claims fell to another pandemic-low last week, U.S. stock indexes edged lower. Claims have been trending lower since mid-July, a sign employers are holding on to workers despite a rise in Covid-19 infections. The path to employment growth may not be a smooth one, but most indicators point to a continued rebound.
After a blockbuster second-quarter earnings season, investors have now turned their attention to the Federal Reserve’s plan to slow it’s $120 billion a month bond buying program. That is expected to begin later this year. No interest rate increase for 2021 is anticipated by the Fed. That will probably come later in 2022. Reducing their bond-buying is the first step in slowly taking the central bank’s foot off the gas pedal of the U.S. economy.
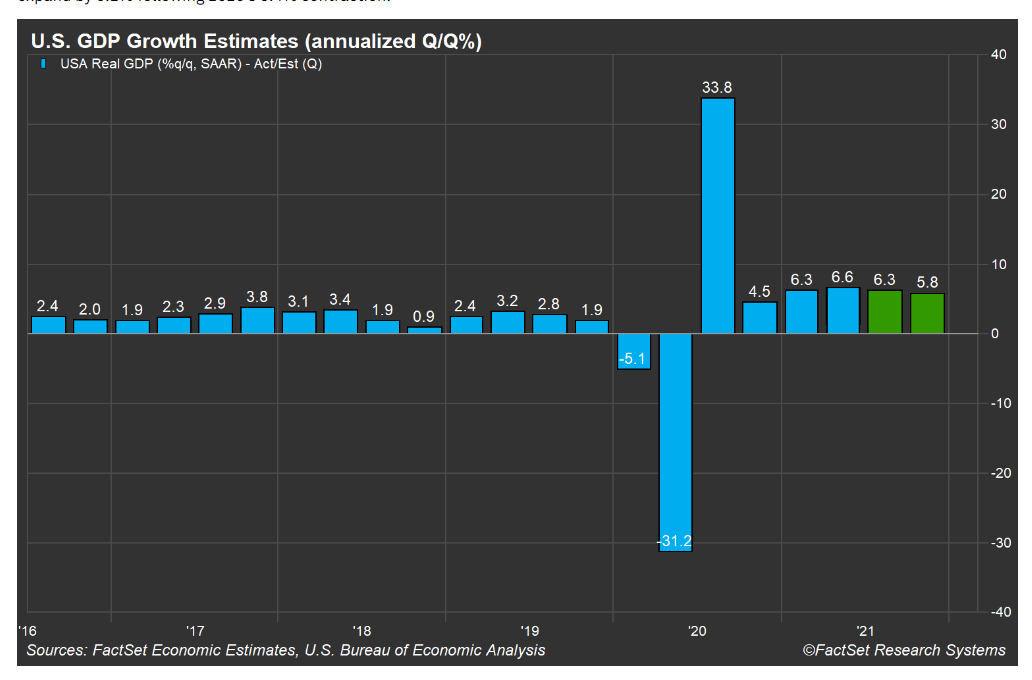
A recent posting by FactSet said there are five charts to watch as we move through the final four months of 2021. They are; U.S. GDP Growth, Inflation, Initial Jobless Claims, Supply of Homes for Sale and New Car and Truck Prices. This week I want to look at the first two charts.
I believe the first chart is the most important because in the end, it is all about the growth of the economy. This chart alone shows you why so many analysts continue to be bullish on economic growth in the U.S. After the sharp drop in GDP due to the pandemic and the subsequent rebound, the numbers have been much higher than they were going back several years. If this trend continues, we’ll have nothing to worry about for a few years.
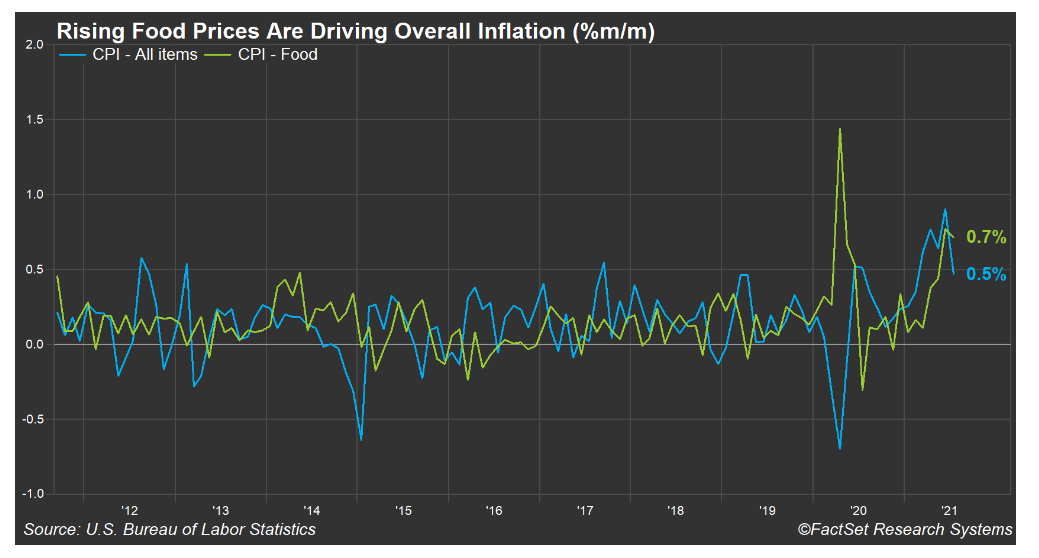
The inflation chart below can be difficult to make any sense of, but the important thing to notice is the green line represents the increase in food prices and the blue line is the overall cost of goods and services at the consumer level. With food prices rising at a much sharper rate, it would most likely result in the blue line eventually rising too. Persistent higher inflation for the economy could result in much lower growth.
Next week we’ll look at the other three charts. If you have any questions, please contact me.
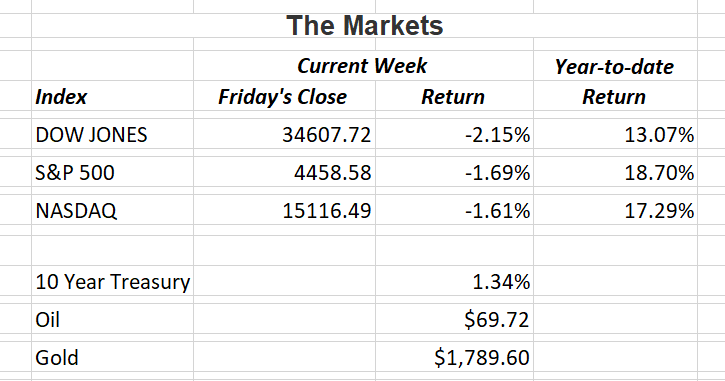
The Markets and Economy
- The Social Security increase announced in January 2022 is estimated to be 6.2%. The cost-of-living-adjustment has only been 4% twice in the last 30 years.
- Keep your eyes on the stock market this month. September has been the worst performing month for stocks over the last 30 years.
- The good news is, this year’s 2021 U.S. fiscal deficit will come in at $3.115 trillion. That’s lower than last year’s $3.129 trillion. However, it is still the second highest on record. Last year’s was the highest.
- The housing market in China helps fuel the economic engine in the world’s second-largest economy. Construction, materials and housing appliances help account for 16.4% of China’s economy. Analysts are concerned that government officials campaign of tighter oversight and regulation could have severe consequences for continued economic growth.
- Ford Motor Co. announced it will stop manufacturing cars in India, the world’s second-most populous country. American auto makers are finding it difficult to gain a foothold in the passenger vehicle market in many countries. Recently, General Motors Co. halted truck and passenger bus production in Germany for the same reasons.
Offices in Chicago, Kansas City, St. Louis, Naples & Valparaiso.
The Standard & Poor’s 500 (S&P 500) is an unmanaged group of securities considered to be representative of the stock market in general. The Dow Jones Industrial Average is a price-weighted index of 30 actively traded blue-chip stocks. The NASDAQ Composite Index is an unmanaged, market-weighted index of all over-the-counter common stocks traded on the National Association of Securities Dealers Automated Quotation System.
Opinions expressed are subject to change without notice and are not intended as investment advice or to predict future performance.
Consult your financial professional before making any investment decision. You cannot invest directly in an index. Past performance does not guarantee future results.
Note: All figures exclude reinvested dividends (if any). Sources: Bloomberg, Dorsey Wright & Associates, Inc. and The Wall Street Journal. Past performance is no guarantee of future results. Indices are unmanaged and cannot be invested into directly.
Securities offered through Triad Advisors, member FINRA/SIPC. Investment advice offered through Resources Investment Advisors, LLC, an SEC-registered investment adviser. Resources Investment Advisors. LLC and Vertical Financial Group are not affiliated with Triad Advisors.